Deep Log Analyzer 7.1 - Web Analytics Software
Interactive Reports for your website
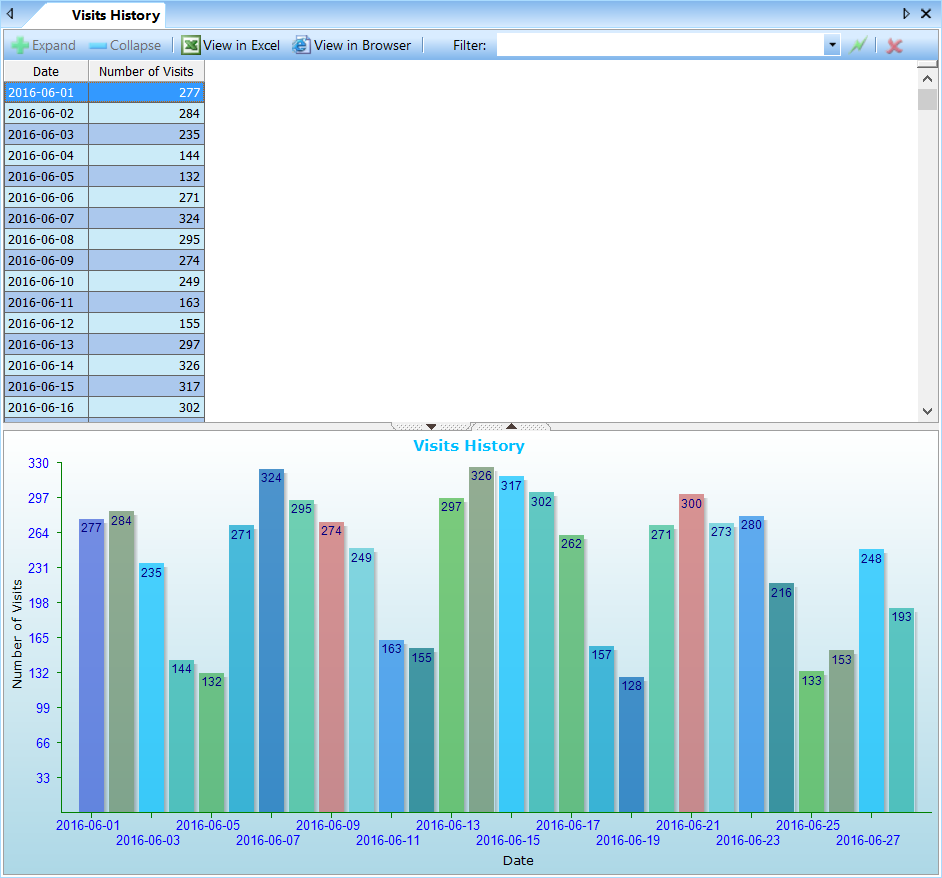
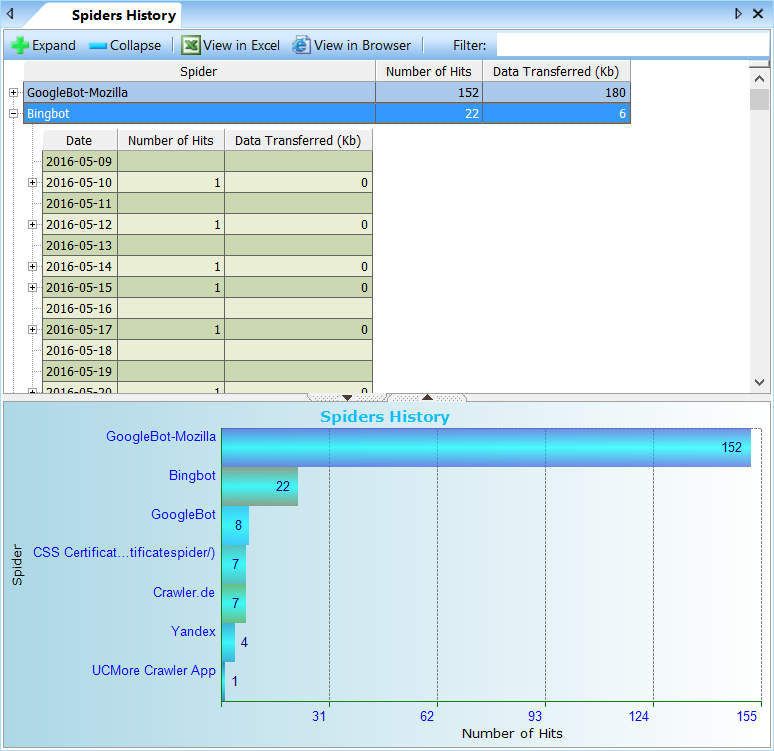
Hierarchical view
View reports for your website in a hierarchical representation. This is convenient because most website statistics have hierarchical nature.
Navigate reports easily
- Select any of 50+ reports included in the software and view the results for your website
- Scroll a report easily, sort it by any column with just one click
- Navigate multiple levels of hierarchy
Graphical charts
All reports are accompanied by graphical charts representing the report’s data. View its own chart for each level of hierarchy. Bar graphs change immediately as you navigate from one level to another.
Filter reports by dates
- Select dates interval in the calendar to view reports for the period;
- Quickly apply a pre-defined filter, such as Today, Yesterday, This week, This month, etc.
- Drag your mouse in the calendar to quickly select a range
- Compare the same report for different intervals on separate tabs. Research the effects of important changes you’ve made to the website
Reports on all aspects of the web site
Accessed resources on the website
- Reports on most requested Pages, Downloads and Graphics shows what content is popular on your website and how visitors find that content.
- Entry(Landing) Pages and Exit Pages reports shows where users enter your website and from which pages they leave it. For example, find out how the landing pages for ad campaigns perform.
- Single Access Pages report helps to determine pages with weak content and high bouncing rate. It shows on which pages users leave web site without viewing other pages. Such pages may need revising.
- Visitors Bouncing Rate report shows how many users entered the website through the particular web page and exited the site right away (bounced). This allows to estimate quality of your website landing pages and improve website browsing rate.
- View how many times visitors open/download PDF files published on the website in our new Top Pages by Visits report.
Visitors activity
- Visits history and Hits history reports show how your web site popularity changes over time.
- Top Visitors report shows the number of visits for each visitor along with a browser and Operating System or mobile device they use and their country.
- View what Days of week and hours of day get most hits and visits and generate load picks on your web server.
- Top Countries report is fast and does not require a slow DNS lookup process. Program includes a countries database for fast lookup.
Referrals and Search Engines
- Know where your visitors come to the website from. Get a comprehensive set of reports showing all Referring websites & pages, Search engines and Search phrases that drive visitors to you website.
- View a trend for every statistic in this group. With the hierarchical reports presentation you will dig deeper into referral reports and understand where your visitors come from. A useful addition for your search engine optimization efforts.
- Search spider reports show when search engine bots/spiders visit to index your website and what pages they index. Make sure that search spiders index all of the content your website has.
- Deep Log Analyzer recognizes all latest browsers and search bots as we update their definition lists regularly. You can add your own search engines definitions if needed.
Website Navigation
- See how visitors navigate through your web site. Popular Paths through Site report shows the list of typical ways users take while browsing the website.
- Came from Page and Left to Page reports show from which pages users arrive to the particular page and where they went from there.
Visitors System Info
- See the Operating systems (OS), Mobile devices and Browsers your website visitors use. Optimize your website for the most popular browsers, screen resolutions and color depth. Recognize all modern browsers and platforms including all versions of Windows, Mac OS, iOS, Android, Google Chrome, Microsoft Edge, IE, Firefox and many more.
- View reports on the number of browsers with/without Javascript support, Flash plugin versions, Visitor’s System Language
Technical reports
- See all website errors generated by the web server, including 404, 5XX and more. Other web-based web analytics tools do not allow this.
- Check for broken links and on the website with Page Not Found report.
Customization and extensibility
Create custom reports
Design custom reports using SQL queries. It is possible to create any specific report you may need about web site as all required data is stored in well designed relational database.
Download custom reports for Deep Log Analyzer
Reports Scheduler
Deep Log Analyzer can process updated log files and genrate reports in HTML format automatically by schedule. You can this featire on server, for example, to create up-to date reports for websites automatically
Automation via scipts
Program can be scripted with JavaScript, VBScript or any other scripting languages supporting OLE Automation. This allows you to automate log files import, reports generation and exporting to HTML and other tasks.
Standard database format
- Deep Log Analyzer imports the information from the log files into Microsoft Access® format .mdb database. This is a reliable and safe storage for your website statistics that allows you access the data from external programs. Other web stats programs use proprietary database formats and you do not have access to raw data.
- Create custom reports in MS Access® using its intuitive SQL query designer
Integrate with other databases
When creating custom reports you can combine website data with other databases such as content management, sales or CRM database, etc. Create advanced internet marketing reports that help making smart business decisions and improve company’s web site effectiveness, calculate ROI (return on investment)
XML configuration files
All reports definitions and settings are stored in the open XML format. Edit XML files easily and tweak every aspect of Deep Log Analyzer reports. Edit search engines, browsers, OS and spiders definitions and other settings that are stored in simple text format.
Easy User Interface
Tasks pane for quick access to common commands
The Tasks pane lists the common tasks that you may need to perform when analyzing your website. Access more specific or advanced tasks from numerous program menus.
MS Office style look and feel
Deep Log Analyzer user interface is similar to Microsoft Office that makes it easy to work in familiar environment. User interface is simple and powerful with sliding panels, menu animation, docking bars and menus, gradient colors and more. 5 application looks to choose from
Simple Wizards for common tasks
Create projects and reports, export or import custom reports and perform other advanced tasks easily using simple wizards with step by step instructions.
Customize user interface as you like
Every aspect of user interface can be customized in Deep Log Analyzer. Move and dock all panels and toolbars around the screen to create a workspace that you like. Edit or create own menus and toolbars. Change or set hotkeys for the tasks you perform often. Even customize toolbars on the fly while holding Alt key.
System Requirements
Minimum
Deep Log Analyzer can be installed on the computer with this minimum configuration
Windows 10/8/7/XP or Windows Server 2019/2016/2008
CPU: 1 GHz
RAM: 1 GB
HDD space: 25 MB plus space for databases and logs
Recommended for best performance
Windows 10 or Server 2012 or newer
CPU: 2+ cores
RAM: 4+ Gb
HDD space: 1+ Gb


